This 2nd quarter update to my initial gubernatorial race ratings looks at the probability that either party will win the November governors elections for each state. Many pundits like to assign races to categories of likelihood of a particular party winning using the categories of Safe, Likely, Lean, and Tossup and I do as well. I'll also go one step further and give percentage chances for each category, but note I'm not using a formal model and these are just to give you a rough idea of my confidence:
Safe - That party has over a 95 percent percent chance of winning. The other party has no realistic options for victory under present or expected circumstances.
Likely - That party has over an 80 percent chance of winning and is the heavy favorite. However it is possible that the situation might change and the other party has a potential path to victory.
Lean - That party has over a 60 percent chance of winning and is a narrow, but clear favorite. This race will be competitive and it is quite plausible that the other party could win with changing circumstances.
Tossup - Both parties have less than a 60 percent chance of winning and the heavily contested race could easily go either way even if one party might be favored from week to week.
With that system in mind, let's take a look at the playing field mapped out and in chart form, while you can find an interactive map with various biographical and electoral stats here.
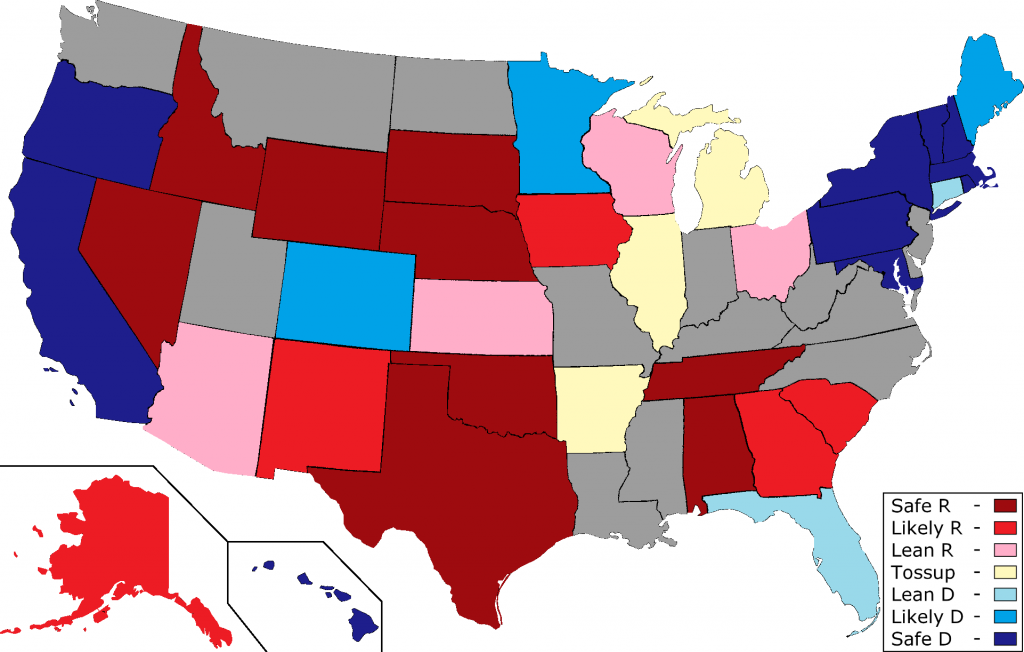
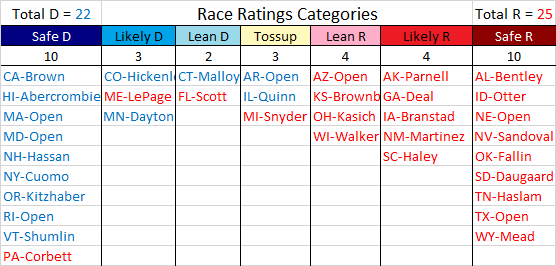
Following the disastrous 2010 elections Republicans built up a commanding lead in governors offices, particularly considering how many people are represented by each party. Currently there are 21 controlled by Democrats and 29 by Republicans with their party governing 56 percent of the (2010 census) population of the 50 states. Of the 36 states with 2014 gubernatorial elections, 14 are held by Democrats while 22 are held by Republicans. Aggregating all the races not up for election with those rated Lean or stronger for either party yields 22 for Democrats, 25 for Republicans, and 3 Tossups.
At present I expect 4 states to change hands with Republicans gaining Arkansas while Democrats gain Florida, Maine, and Pennsylvania and while that number is low it would represent a net gain of nearly 10 percent of the 50-state population for Democrats which would result in their governors representing the majority of Americans. Republicans would also lose their legislative trifecta in both Florida and Pennsylvania and Democrats would likely gain it in Maine, while Republicans already effectively have total legislative control in Arkansas with just a simple majority required to override vetoes. Control of state legislatures could also change, but that is more difficult to predict nationwide.
Compared to last quarter, four races saw a ratings change: Colorado from Lean to Likely D, Iowa from Safe to Likely R, Kansas from Likely to Lean R, and Pennsylvania from Likely to Safe D. Since there are just 36 races I'll detail them individually below the fold, though much of this section is the same as last quarter for races that did not see significant changes. You can also view my Senate and House ratings.